
chrome-devtools-mcp package to connect desktop AI agents to a live Chrome browser. The server gives your agent browser automation tools plus the ability to discover and call WebMCP tools registered on any page.
The former @mcp-b/chrome-devtools-mcp fork is retired. Use chrome-devtools-mcp@latest in new MCP client configs.
Install the MCP server
Add the server to your MCP client configuration:Test the connection
Enter this prompt in your MCP client:Discover WebMCP tools on a page
When a webpage has@mcp-b/global installed, the server detects its tools through the Chrome DevTools Protocol. Ask your agent:
list_webmcp_tools to discover tools, then registers them as first-class MCP tools with prefixed names like webmcp_webmcp_sh_page0_tool_name. You can call them directly.
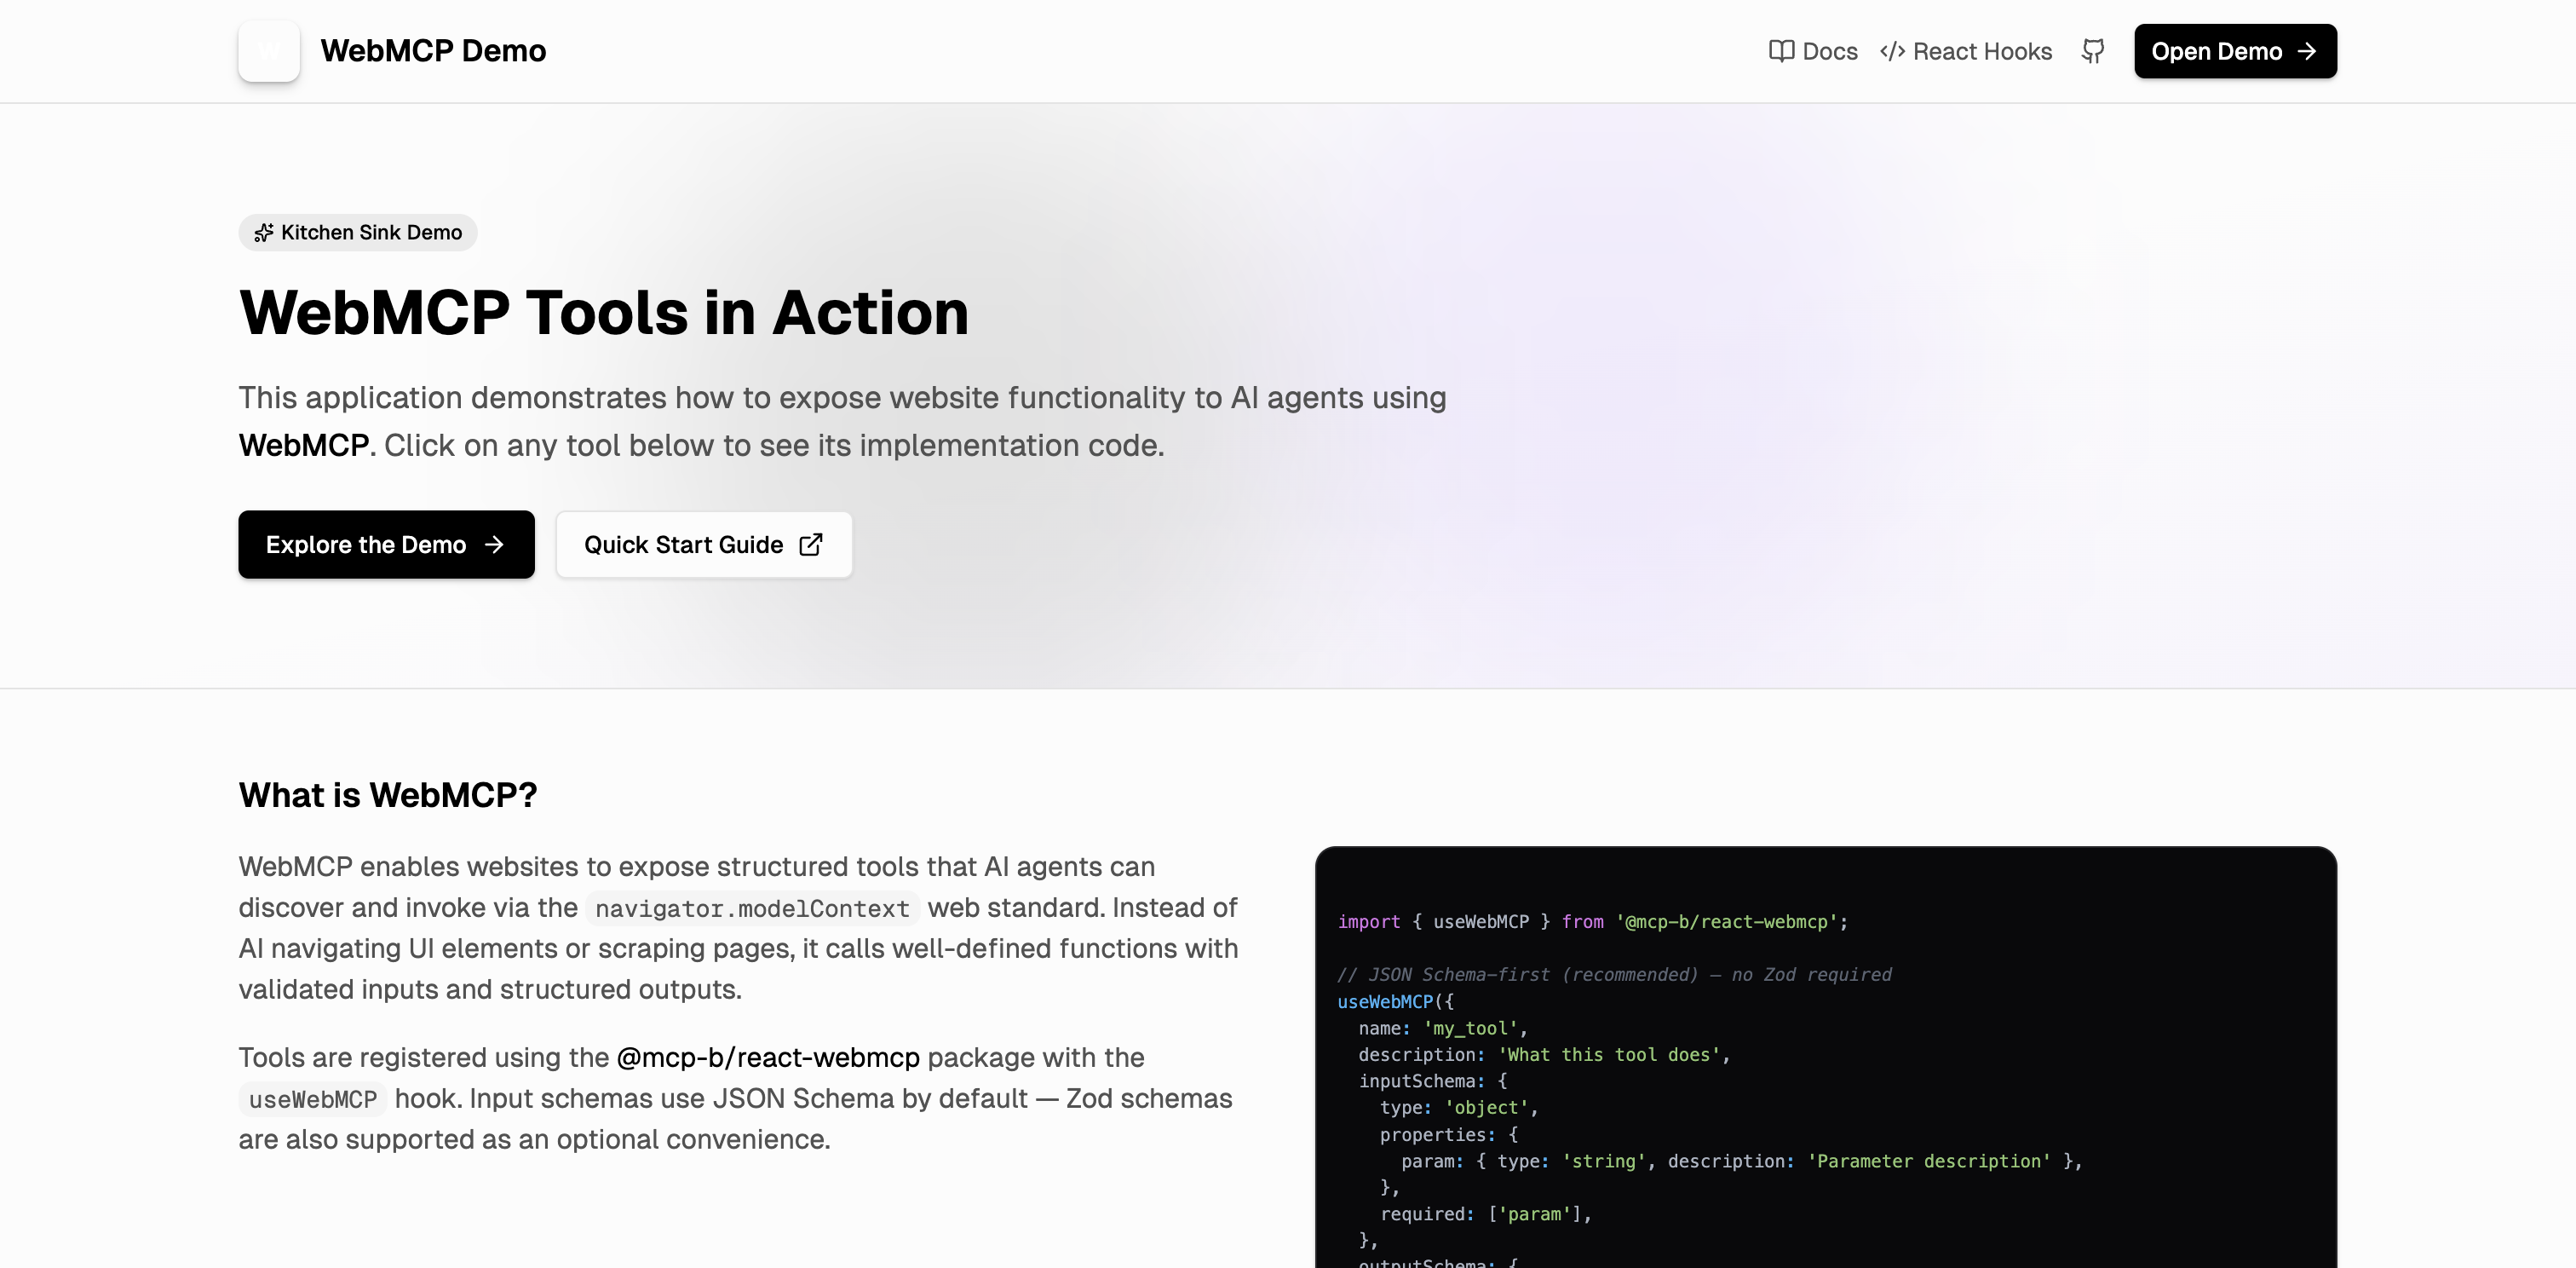
webmcp.sh registers tools for navigation, data management, SQL queries, and more
sql_query tool and returns structured query results from the in-browser database.
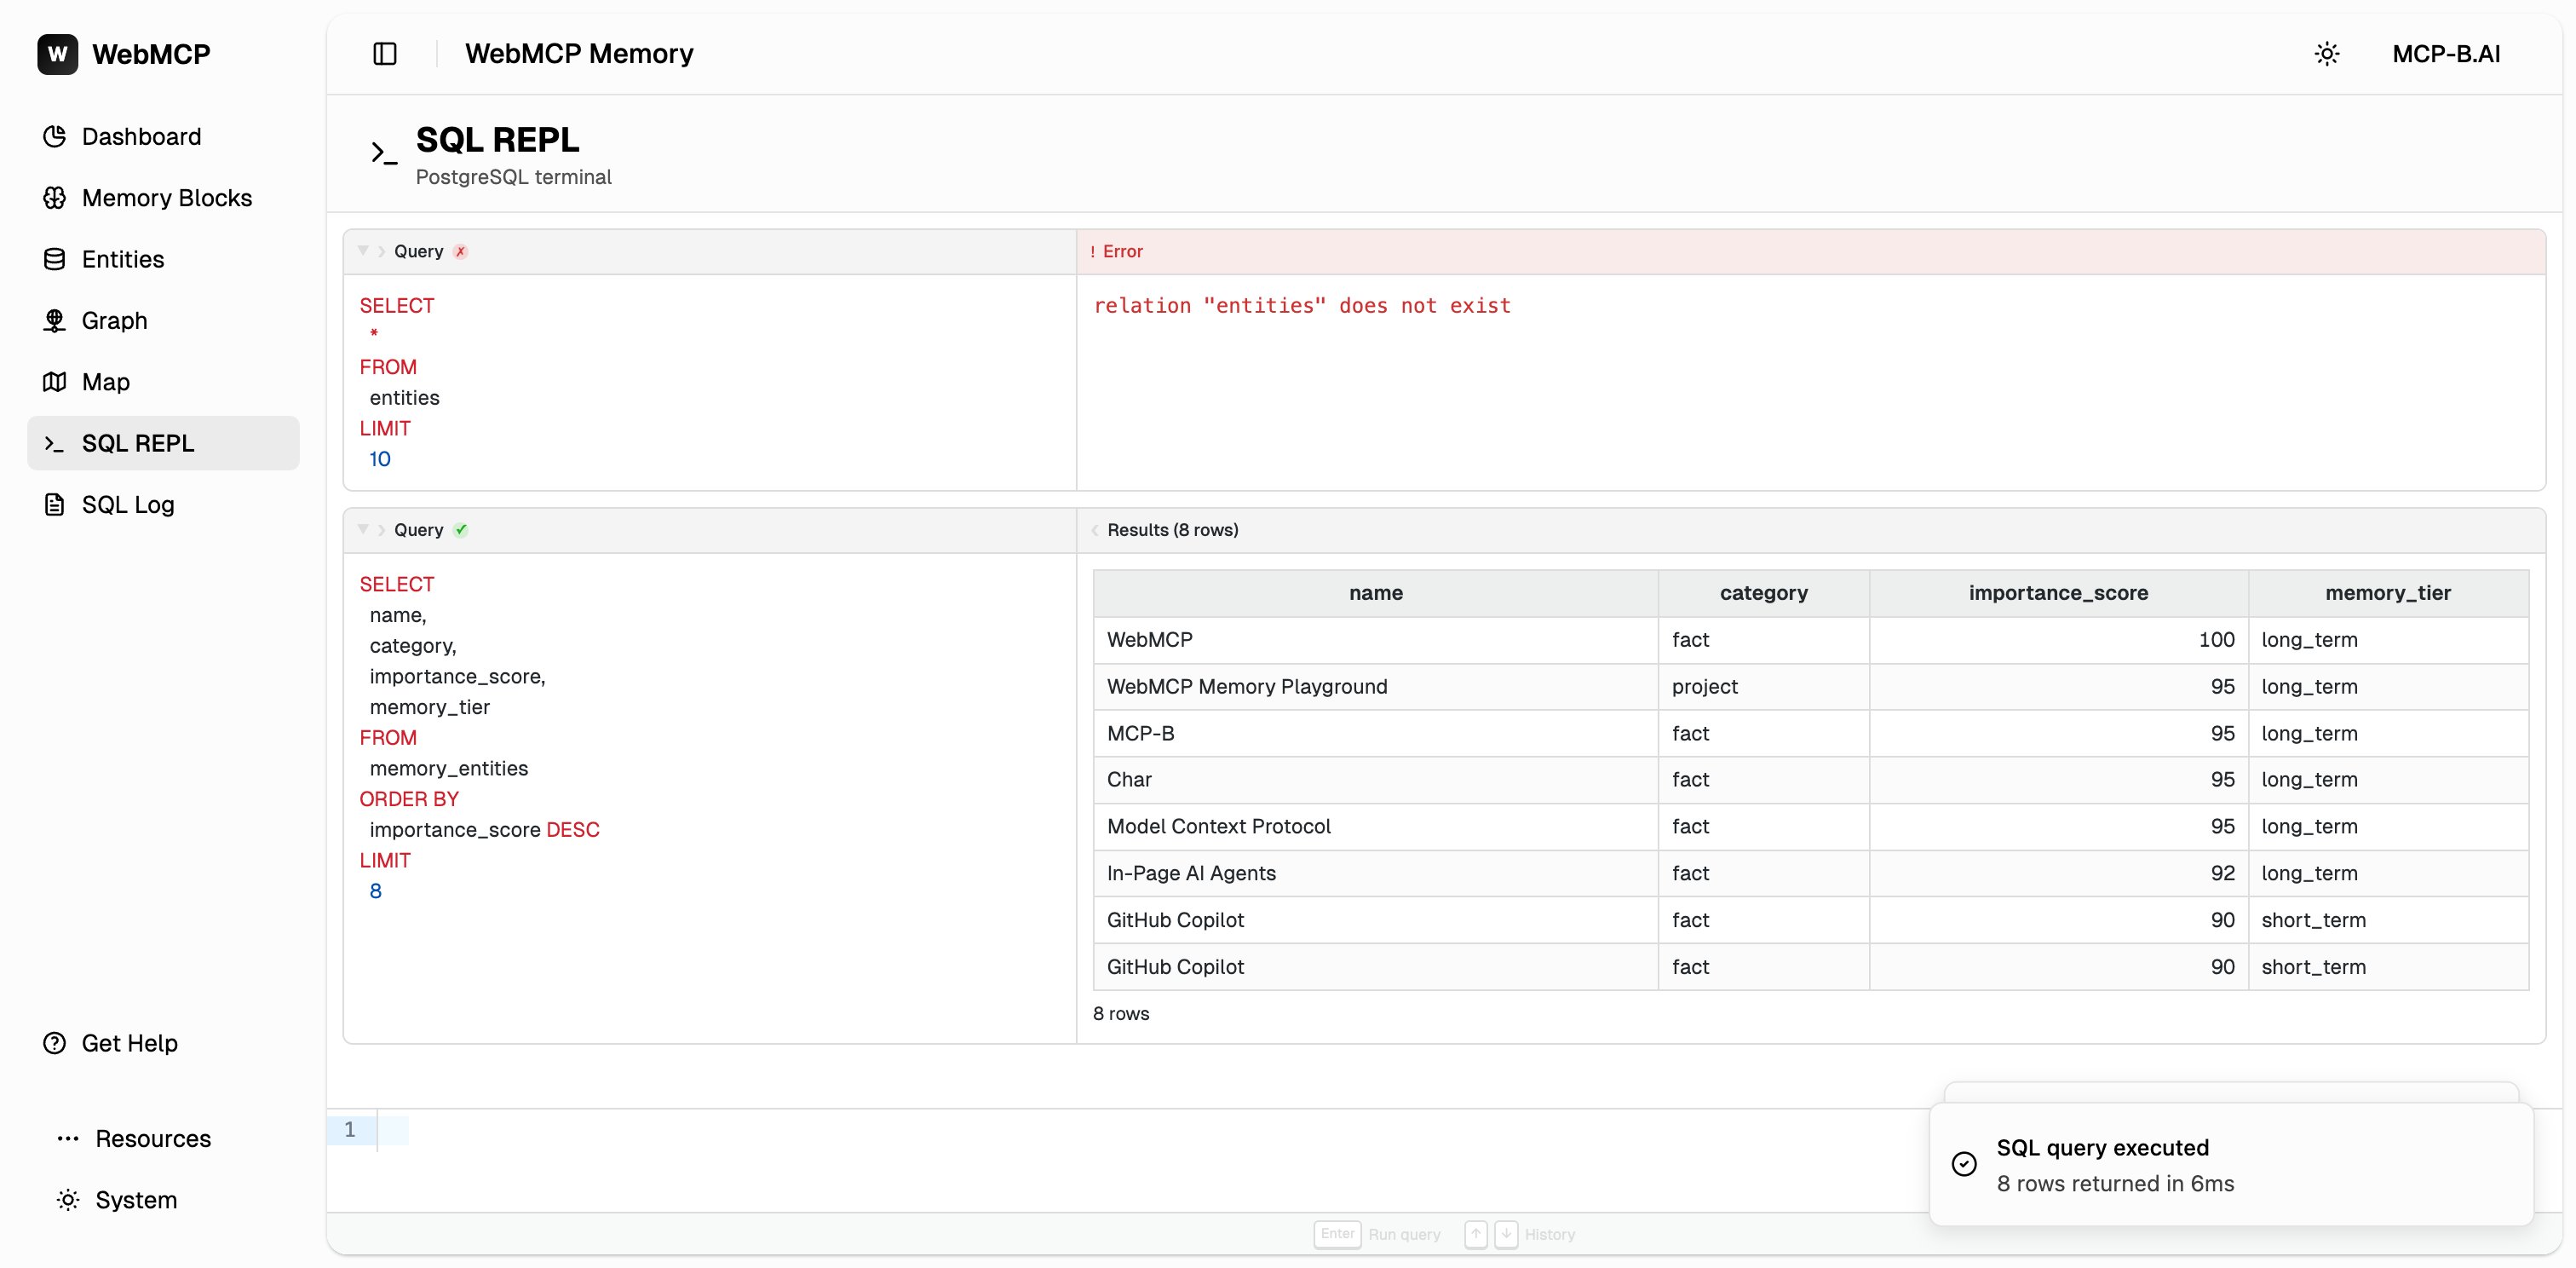
The agent called the sql_query tool to query the in-browser PostgreSQL database
list_webmcp_tools is diff-aware. The first call returns the full tool list. Subsequent calls
return only added or removed tools. Pass full: true to force the complete list.Client compatibility for dynamic tool updates
Use the AI-driven development workflow
The most powerful use case is building WebMCP tools with your AI agent in a tight feedback loop. Clone the Chrome DevTools Quickstart for a minimal project with@mcp-b/global pre-installed, or use your own app.
1
Ask your agent to create a tool
2
The agent writes the code in your app
3
Your dev server hot-reloads the change
4
The agent discovers the new tool
5
The agent tests the tool
6
The agent iterates if something fails
The agent sees the actual response, fixes bugs, and repeats until the tool works.
Built-in prompts
The server includes prompts that guide agents through common workflows:
Example:
Connect to an existing Chrome instance
By default, the server launches its own Chrome with a dedicated profile. If you want to use an existing Chrome session (to preserve login state or avoid WebDriver restrictions):Auto-connect (Chrome 144+)
1
Enable remote debugging in Chrome
Navigate to
chrome://inspect/#remote-debugging and follow the dialog to allow debugging connections.2
Use the autoConnect flag (enabled by default)
Manual connection via remote debugging port
1
Configure the MCP server with a browser URL
2
Start Chrome with remote debugging enabled
Common configuration options
Pass options through theargs array in your MCP client config:
For the full list of options, see the upstream Chrome DevTools MCP repository.
Troubleshoot common issues
Related pages
- Chrome DevTools MCP retired package note for migration from the old
@mcp-bfork - ChromeDevTools/chrome-devtools-mcp for the full upstream tool list and CLI options
- Connect Desktop Agents with the Local Relay for an alternative approach that works with any website
- Debug and Troubleshoot for general debugging strategies